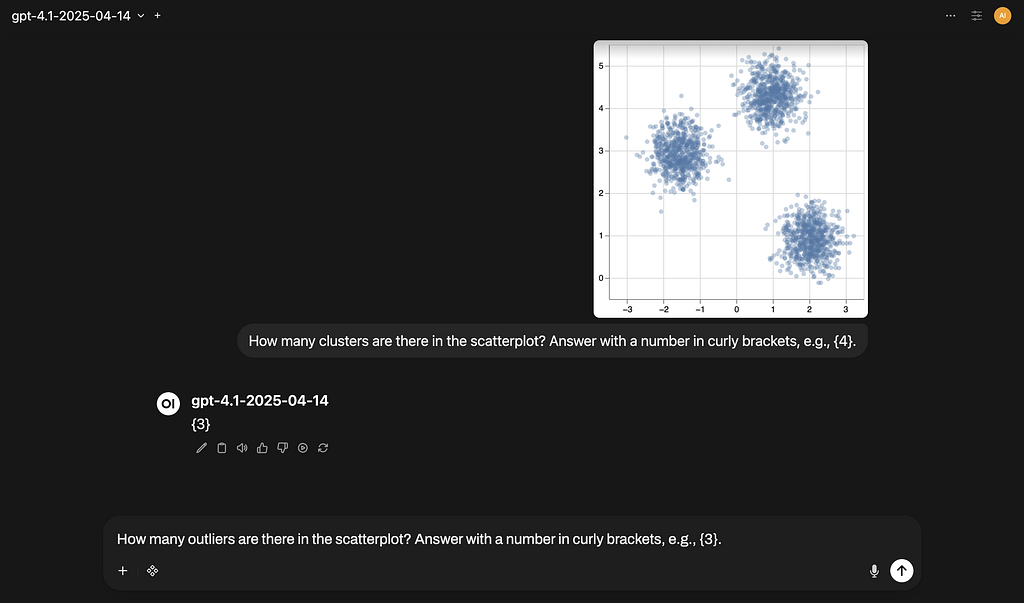
Benchmark It Yourself (BIY): Preparing a Dataset and Benchmarking AI Models for Scatterplot-Related Tasks When we need to visualize and interact with millions, or even just thousands, of individual points while analyzing data, we typically resort to rendering them in the browser using a canvas . The other common approach for the web, SVG, doesn’t scale when the number of…
#data-visualization
3 posts
19 Jan
22 Nov 2024
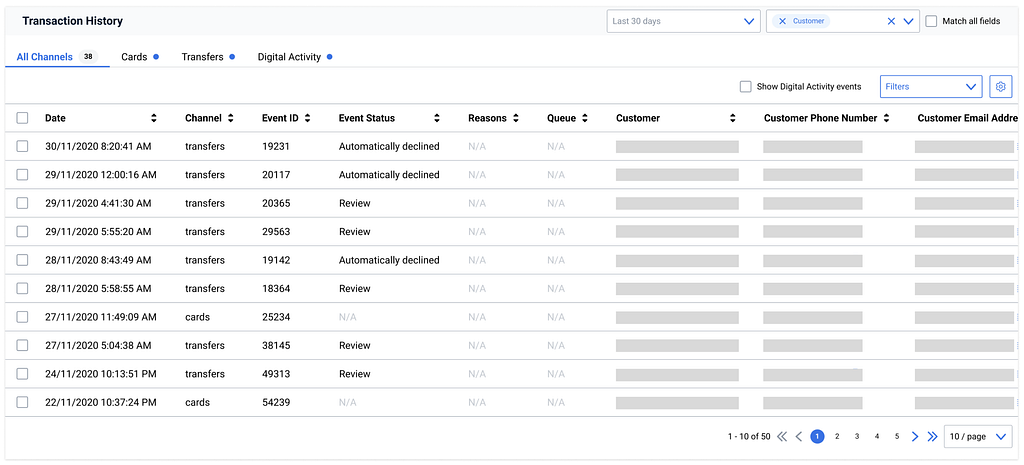
Every year, millions of people fall victim to financial fraud. In 2023, the losses tied to this type of crime were estimated at US$159 billion just in the US , with some people losing all of their retirement savings to scammers . However, the impacts of this issue stretch beyond someone’s finances. It can also impact a victim’s life in…
7 Mar 2023
Make your reports faster: A beginner’s guide to Tableau Optimisation In today’s world, given the pace at which data operates, we need a tool that can help us to generate reports faster and bring out insights within milliseconds. In order to solve this challenge, several companies have started utilising a few Business Intelligence (BI) tools such as Tableau/Power BI/Superset/Looker/Qlikview, etc.…